Medical display projects typically budget for hardware acquisition and initial calibration, but often overlook the long-term maintenance expenses that emerge as displays gradually drift from their baseline specifications—especially in multi-site deployments where service logistics, clinical sign-off, and audit documentation multiply the downstream impact.
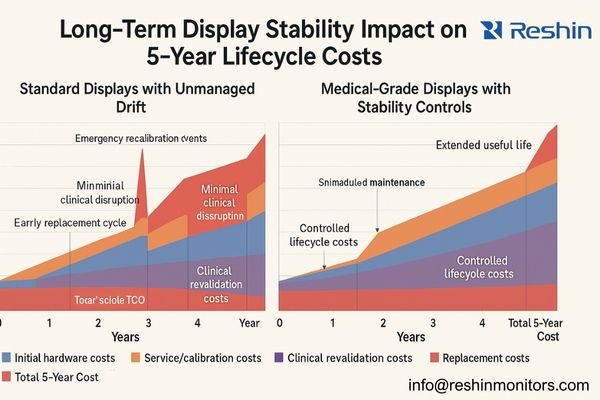
When properly managed, long-term stability of medical displays transforms unpredictable service costs into controlled maintenance events, reducing total lifecycle expenses by minimizing emergency recalibrations, unplanned replacements, clinical acceptance disputes, and multi-department workflow disruptions—factors that often become a major portion of 5-year integration project cost in complex, multi-department environments.
In my experience integrating display systems across healthcare environments, I’ve noticed that initial acquisition costs represent only a fraction of the true financial impact. The hidden cost drivers1 emerge months and years after installation, when displays begin to drift from their calibrated state. As luminance levels decrease, uniformity becomes inconsistent, and grayscale response shifts, clinical teams encounter what I call the "same site, different screens" problem—where identical studies look different across workstations, compromising diagnostic confidence and consistency. In practical project terms, drift often triggers a predictable chain: user complaint → support ticket → measurement/verification → corrective action → clinical revalidation → documentation update.
The financial impact of display instability is rarely captured in a single budget line. Instead, it disperses across multiple operational categories that escalate over time. This fragmentation makes lifecycle costs difficult to predict and manage without a stability-focused approach. Note that these influences can overlap in real projects (they are not strictly additive), because one drift event can simultaneously drive service time, clinical revalidation, and documentation work.
| Cost Category | Stability Impact | Typical 5-Year Cost Influence |
|---|---|---|
| Service Calls | Unplanned calibration requests, "image looks different" tickets | 15-20% of TCO |
| Clinical Rework | Repeat studies, second opinions, comparison challenges | 10-15% of TCO |
| Compliance Risk | Failed audits, documentation gaps, regulatory findings | 5-10% of TCO |
| Replacement Timing | Premature replacement vs. extended useful life | 20-30% of TCO |
Healthcare technology leaders often focus on upfront specifications and initial calibration during procurement, missing how display performance naturally degrades over multi-year deployments.
Long-term stability becomes a hidden cost driver when clinical teams detect display inconsistencies that trigger unplanned service interventions, with each correction cycle requiring engineer time, recalibration equipment, documentation updates, and clinical revalidation—costs that typically remain unattributed to poor initial display selection.

I frequently see project managers underestimate the downstream costs of display instability. When luminance and grayscale response drift beyond clinical tolerance, the expenses aren’t limited to simple hardware fixes. The real reason this becomes "hidden" is that costs are split across owners and budgets: IT absorbs ticket volume, clinical engineering absorbs verification effort, radiology absorbs revalidation time, and vendors absorb escalations—while procurement decisions were often made under a different cost center. When "who pays" and "who decides" are misaligned, stability risks are easy to discount upfront and expensive to rediscover later.
First, there’s the technical troubleshooting cycle—identifying which displays are outside acceptable parameters, determining if the issue is hardware degradation or configuration drift, and deploying appropriate remediation. Second, clinical revalidation consumes physician and technologist time to verify that displays again show consistent presentation. Third, there’s documentation overhead to maintain compliance records showing the problem identification, correction, and verification. Finally, there’s often interdepartmental coordination as IT, clinical engineering, radiology, and vendor teams collaborate on resolution.
These activities turn what could be planned maintenance into emergency interventions that disrupt workflows and compound costs exponentially compared to systematic stability management. In practice, I group these multipliers into a single controllable concept: verification-loop cost2—time and evidence spent to restore confidence—and stability programs exist primarily to reduce how often that loop is triggered.
What stability metrics matter most across multi-year clinical deployments?
Medical display projects need concrete metrics to transform "stability" from a marketing term into actionable specifications and acceptance criteria.
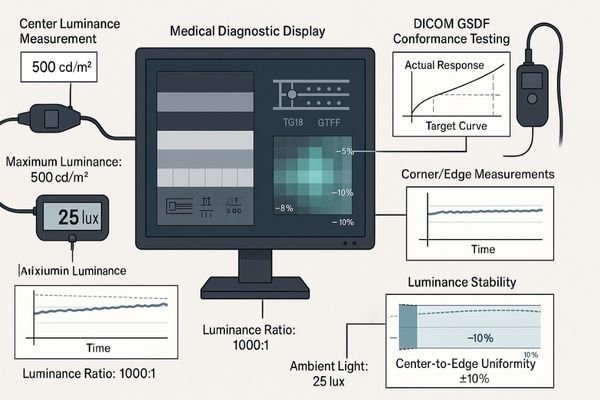
The most critical long-term stability metrics for medical displays are luminance decay rate (<10% per year), DICOM GSDF conformance persistence (Delta <10%), uniformity maintenance across screen areas (±15% maximum deviation), and ambient light compensation reliability—as these directly impact diagnostic accuracy and determine maintenance frequency.
Perceptual Consistency Metrics
In my calibration work, I find that perceptual consistency forms the foundation of clinical acceptance. These metrics directly impact how reliably clinicians can interpret subtle diagnostic features:
- DICOM GSDF Conformance Stability3: How consistently the display maintains the standardized grayscale response curve over time
- Low-Contrast Detail Retention: The ability to maintain visibility of subtle grayscale differences, particularly in darker regions
- Screen Uniformity Persistence: How well the display maintains consistent brightness and contrast across all screen areas, avoiding hot spots or shadowing that develop over time
From a lifecycle-cost standpoint, these metrics primarily drive clinical revalidation cost: when perceptual consistency breaks, clinicians spend time re-checking, re-comparing, and re-accepting—often the most expensive “hidden” component because it consumes scarce clinical time.
Aging and Control Metrics
These metrics predict how rapidly displays will drift from their calibrated baseline:
- Luminance Decay Rate: The predictable decline in maximum and minimum luminance values (measured in cd/m²)
- Backlight Stability: How consistently the display maintains its backlight output over thousands of operating hours
- Temperature Response: How ambient and internal temperature fluctuations affect display performance
- Automatic Stabilization Effectiveness: How well internal sensors and correction mechanisms compensate for natural aging
These metrics determine maintenance frequency and replacement timing. Better aging control reduces emergency interventions, allows planned downtime windows, and supports longer useful life—directly improving budget predictability over a 3–5 year horizon.
Environment and System Coupling
These often-overlooked metrics determine how the display interacts with its environment and the rest of the imaging chain:
- Ambient Light Compensation Accuracy: How effectively the display adjusts to changing room lighting conditions
- Workstation Rendering Path Stability: How consistently the display integrates with GPU and PACS presentation states
- Configuration Persistency: How reliably calibration settings are maintained through system updates and power cycles
These coupling metrics are often the difference between true hardware drift and “apparent instability” caused by integration gaps. When coupling is unstable, teams misdiagnose issues, open unnecessary tickets, and repeat acceptance steps—creating avoidable integration rework that inflates lifecycle cost.
How can vendors design stability into standards, QA, and service plans?
Effective stability management requires structured approaches that extend beyond initial calibration to encompass the entire display lifecycle.
Designing stability into medical display deployments requires three integrated components: evidence-based acceptance standards with explicit drift tolerances, a standardized QA/QC program with defined verification intervals, and service plans that transform unpredictable interventions into scheduled maintenance—all supported by consistent documentation templates.

Defining Stability Standards
When I develop standards for imaging vendors and hospitals, I focus on operational definitions that drive consistent maintenance:
- Explicit Drift Tolerance Bands4: Defining not just initial calibration targets but acceptable deviation limits before intervention is required
- Verification Methodology: Standardizing the test patterns, measurement equipment, and procedures used to assess stability
- Intervention Triggers: Clear thresholds for when recalibration, adjustment, or replacement becomes necessary
The practical goal is simple: drift bands + verification cadence + trigger actions convert “unexpected failures” into scheduled work orders, with predictable time, tools, and approval steps.
Operationalizing QA/QC Programs
Standards become effective only when implemented through structured quality programs:
- Verification Cadence: Establishing appropriate intervals for quick checks versus comprehensive recalibration
- Role Responsibility Matrix: Defining who performs which checks, from daily visual assessment to formal calibration
- Record Management: Creating unified templates and storage systems for maintaining verification history
When the cadence and records are consistent, trend data becomes useful—allowing teams to intervene before clinicians notice inconsistency, rather than after the first complaint.
Service Policy Integration
To keep lifecycle cost controlled, service policy should read like an engineering decision tree, not a general promise: if drift is within band → log and continue; if drift approaches threshold → schedule recalibration; if drift exceeds threshold repeatedly → escalate to replacement planning; if apparent instability correlates with updates → verify GPU/PACS coupling before touching hardware. This threshold-driven workflow prevents over-servicing (wasting cost) and under-servicing (creating clinical disputes), while keeping evidence ready for audits.
When these components work together, display management shifts from firefighting to controlled maintenance. For vendors aiming to reduce rework and stabilize multi-site deployments, contact our engineering team at info@reshinmonitors.com.
What implementation steps reduce lifecycle cost without over-engineering?
Practical stability management balances comprehensive monitoring with resource constraints to optimize lifecycle costs without excessive overhead.
Optimizing medical display lifecycle costs requires targeted stability control at key points: unified baseline calibration with exportable configurations at deployment, integrated verification of the entire imaging chain during acceptance testing, and lightweight but consistent maintenance protocols with clear escalation triggers during operation.

Deployment Phase Optimization
In my integration projects, I emphasize these initial stability foundations:
- Unified Baseline Calibration: Establishing consistent starting points across all displays, even when different models are used for different roles
- Configuration Export/Backup: Creating portable profiles that can restore settings if drift occurs
- Environmental Assessment: Documenting ambient light conditions and controlling factors that accelerate display deterioration
Integration Phase Controls
The critical stability checkpoints during system integration include:
- End-to-End Verification5: Testing the complete chain from PACS through GPU to display output
- Cross-System Consistency: Ensuring matching appearance across workstations performing similar clinical tasks
- Configuration Protection: Implementing access controls to prevent accidental setting changes
Operational Phase Efficiency
Long-term stability management can be streamlined through:
- Tiered Verification Schedule: More frequent quick checks (visual assessment, basic measurements) with less frequent comprehensive calibration
- Standardized Reporting: Unified templates that simplify comparison and trend analysis
- Threshold-Based Intervention: Clear trigger points that convert subjective concerns into objective maintenance decisions
This balanced approach transforms reactive "fix it when it breaks" cycles into predictable maintenance patterns, significantly reducing both direct service costs and indirect workflow disruption. To avoid over-engineering, I recommend defining a minimum viable stability program that most sites can execute reliably—baseline calibration + quarterly verification + annual comprehensive calibration + clear incident triggers—then increasing frequency only for high-volume or high-risk stations where the cost of inconsistency is demonstrably higher.
Which Reshin medical displays help control lifecycle cost through stability?
Selecting displays with appropriate stability characteristics for each clinical role allows organizations to optimize both performance and lifecycle costs.
In my work, the most scalable approach is to choose displays—and define profiles—around what you can prove and re-prove over time: serial-number-bound calibration evidence, repeatable verification procedures, consistent profile behavior after updates, and audit-ready logs that let field teams verify drift without improvisation. From a lifecycle-cost perspective, the question is less “what features does a display claim,” and more “what evidence can the project team reliably produce at acceptance and during every re-verification cycle.”
Reshin’s approach to display development emphasizes stability as a deliverable: measurable drift behavior under defined conditions, verification workflows that can be executed consistently, and documentation artifacts that support both service efficiency and compliance readiness. This evidence-first framing is what helps integration teams keep TCO predictable across multi-department rollouts.
| Clinical Role / Application | Usage Pattern | Stability Requirements | Recommended Model | Key Stability Features |
|---|---|---|---|---|
| Primary Diagnostic Reading | Continuous daily use with critical diagnostic decisions | Maximum stability, minimal drift, comprehensive verification | MD33G | Advanced luminance stabilization, low long-term drift under defined conditions, comprehensive calibration history logging |
| Multi-modality Workstations | Varied usage across modalities with different visualization needs | Profile consistency, stable transitions between modes | MD32C | Multi-profile stability maintenance, mode-specific calibration tracking, consistent color-to-grayscale behavior |
| Control Rooms & Tech Review | Moderate usage with alignment to primary diagnostic systems | Cost-effective stability matching main diagnostic systems | MD26GA | Matched calibration methodology to diagnostic displays, simplified verification procedures, extended calibration validity |
| Extended Workspace Reading | Combined diagnostic and reporting with varied screen content | Uniform stability across large visual area | MD45C | Zone-specific stability control, consistent edge-to-center performance, calibration synchronization across screen areas |
| Advanced Visualization / 3D | Specialized applications with complex visual requirements | Color accuracy persistence, specialized profile stability | MD51CHY | Color calibration stability, application-specific profile maintenance, preset persistence verification |
The key to lifecycle cost control isn’t simply selecting the most expensive or feature-rich displays for every position. Instead, I recommend matching stability characteristics to clinical needs while maintaining consistent management methods. To make this operational, tie each profile tier to its expected verification cadence, calibration depth, and escalation actions—so you can forecast labor, downtime windows, and replacement reserves, and compute a practical 5-year TCO model rather than guessing.
FAQ
-
How does display drift translate into real integration project costs over time?
Display drift generates costs through multiple channels: unplanned service calls (typically 2-4x more expensive than scheduled maintenance), clinical revalidation time, documentation updates for regulatory compliance, and workflow disruptions during troubleshooting. Projects without stability management often see meaningfully higher total cost over a 5-year period compared to those with structured stability programs, with the gap widening in multi-site or high-volume environments. -
Which stability metrics should be written into acceptance criteria and service contracts?
Critical metrics include maximum luminance decay rate (annual percentage), DICOM GSDF conformance limits (maximum acceptable deviation), uniformity maintenance (center-to-edge variance limits), and automatic stabilization performance verification. Service contracts should specify measurement methods, verification frequency, and clearly define when recalibration or replacement becomes mandatory. -
How often should re-verification and recalibration be performed to balance risk and cost?
Most facilities benefit from a tiered approach: monthly quick visual checks using test patterns, quarterly basic measurements (luminance, uniformity), and annual comprehensive calibration. High-volume or critical diagnostic stations may require more frequent verification, while secondary review stations may extend intervals. The optimal balance minimizes both drift risk and excessive maintenance costs. -
What integration gaps between PACS, GPU, and displays most often inflate lifecycle cost?
Common gaps include uncalibrated GPU output paths that override display calibration, PACS presentation states that conflict with display settings, incomplete ambient light management, and inconsistent QA procedures across the imaging chain. These integration failures often cause display performance to appear unstable even when the hardware is functioning correctly, leading to unnecessary service costs. -
How can vendors structure tiered profiles so not every station requires premium hardware?
Effective tiering matches display capabilities to clinical needs while maintaining consistent management methodology. Create standardized profiles (e.g., primary diagnosis, clinical review, technologist QC) with clearly defined stability requirements for each tier. This allows appropriate hardware selection while ensuring all tiers remain within a unified calibration, verification, and maintenance program.
Conclusion
Long-term stability of medical displays fundamentally reshapes integration project economics. While unstable displays generate unpredictable service costs, clinical disputes, and repeated interventions that can materially increase 5-year TCO in complex environments, properly managed stability transforms these unpredictable expenses into controlled maintenance activities with predictable timing and resource requirements. In one sentence: stability turns TCO from reactive variance into planned cost.
Reshin’s engineering approach focuses on making stability a deliverable asset rather than a marketing claim. We design our displays with measurable stability metrics, provide tools for ongoing verification, and support structured maintenance programs that extend consistent performance throughout the product lifecycle. If you’re evaluating how display stability can improve your integration project economics, our team can help translate technical specifications into practical TCO models tailored to your clinical and operational requirements.
✉️ info@reshinmonitors.com
🌐 https://reshinmonitors.com/
-
Understanding hidden cost drivers can help healthcare professionals make informed decisions and optimize their display system investments. ↩
-
Exploring this concept can provide insights into managing costs effectively and improving stability in display systems. ↩
-
Understanding DICOM GSDF Conformance Stability is crucial for ensuring accurate medical imaging, which directly impacts patient care. ↩
-
Understanding these bands is crucial for maintaining imaging equipment accuracy and reliability. ↩
-
Exploring End-to-End Verification will help you grasp the importance of testing the entire system for optimal performance. ↩