In medical display procurement and deployment, price differences rarely come from the headline specs alone. Two monitors can share the same resolution, size, and brightness on paper but behave very differently once they are integrated, cleaned daily, and operated for long hours.
Medical-grade monitors with similar specs can be priced very differently because the real cost is in long-term stability, integration tolerance, quality screening, surface durability, and calibration/QA traceability—not in the datasheet headline numbers.
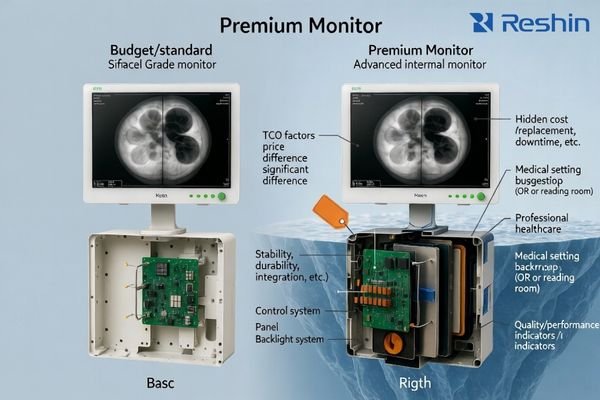
The practical way to evaluate price is to think in total cost of ownership (TCO): how often issues occur, how fast the system recovers from switching, how consistent multiple units look across rooms, how coatings survive disinfectants, and whether performance can be verified and documented over time. The sections below explain the most common “hidden” cost drivers—what they change in real workflows, and how to validate them before you buy.
Why control boards and firmware create “same spec, different price”
Many “similar spec” quotes differ because the internal processing path and firmware behavior determine how the monitor handles real-world signal chains and daily switching—especially in OR and multi-source environments.
With identical ports on the spec sheet, price often reflects switching recovery, handshake tolerance, latency consistency, and how reliably the monitor behaves with converters, matrices, and repeated input changes over long runtimes.
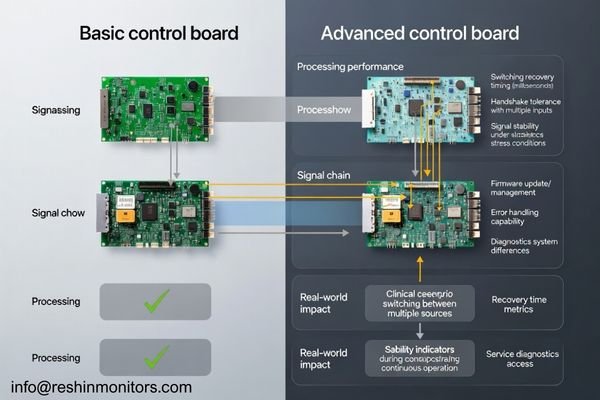
In practice, robust designs1 recover faster after input disturbances, stay stable during repeated switching cycles, and are less sensitive to “edge cases” like mixed formats or timing variations. Firmware maturity also affects service efficiency: clearer diagnostics and predictable behavior reduce troubleshooting time and prevent configuration drift across a fleet.
Processing Architecture and Signal Handling Capabilities
Stronger implementations typically handle scaling, color space handling, and format timing more consistently across sources, which reduces the chance of intermittent black screens, re-sync loops, or unexpected delays when switching. This is where “it works in a demo” can differ from “it stays stable all day” in a real room.
Firmware Development and System Diagnostics
Mature firmware usually means better regression testing, safer update control, and more usable error visibility for service teams. When diagnostics are clearer, integrators can reproduce issues faster and hospitals spend less time chasing “ghost” problems that only occur under certain switching or runtime conditions.
How to validate: request a repeated switching test (multiple sources, many cycles), long-run playback, and recovery-time measurements after unplug/replug or brief signal interruption—using the same switchers/converters you will deploy.
Why panel grading and QC screening drive price gaps
Two monitors can share the same panel resolution and brightness yet differ in screening thresholds, uniformity control, and how consistent units look across deliveries—often a major driver of multi-room standardization cost.
Same resolution and brightness do not guarantee the same panel grade: screening for pixel defects, uniformity tolerance, and mura control drives unit-to-unit consistency and return risk, which directly impacts multi-room deployments.
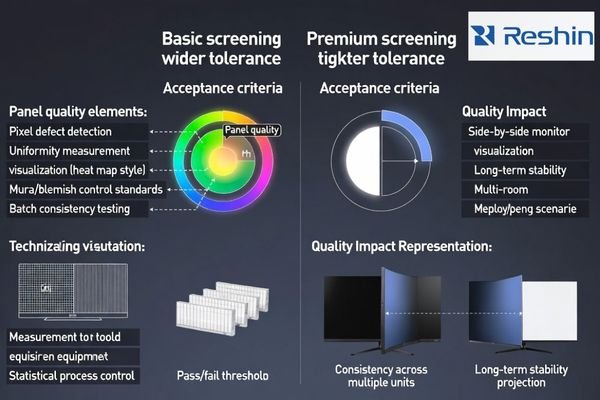
In real installations, panel differences show up as subtle but persistent mismatches: one unit looks slightly darker at the corners, another has a visible non-uniform band, or two “identical” monitors don’t match when placed side-by-side at a station. Those issues become expensive when they trigger user complaints, rework, or replacement logistics—especially in multi-room rollouts where consistent appearance is part of clinical usability and staff confidence.
Higher-tier screening typically means tighter acceptance thresholds and more time spent on inspection and stabilization, which raises manufacturing cost but reduces downstream friction. For the buyer, the value is not a prettier datasheet—it’s fewer returns, fewer exceptions to manage, and fewer “this room looks different” discussions after installation. Consistency also matters across shipments, because facilities often expand deployments in phases and expect the new units to match what is already installed.
How to validate: ask for the vendor’s defect and uniformity acceptance criteria2, request sample-to-sample comparison under the same test pattern, and require a consistent preset/profile across the shipment.
Why backlight engineering affects long-term cost, not just brightness
Peak brightness is easy to list; stable brightness over thousands of hours is expensive. Backlight design, LED binning, drivers, and thermal control often separate price tiers.
Datasheet brightness is a snapshot, but price differences often reflect brightness drift, flicker behavior, and thermal sensitivity—factors that determine whether the image stays stable over long clinical runtimes.
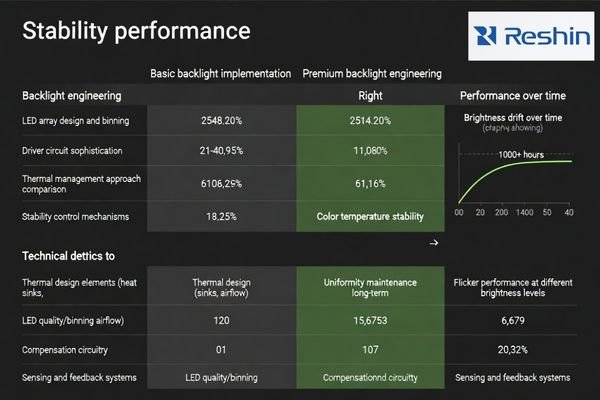
When stability is weak, the display may shift over time, appear inconsistent across units, or become uncomfortable under long viewing sessions. Better designs maintain a more predictable white point and luminance behavior, which reduces recalibration burden and unexpected “it doesn’t look right anymore” complaints.
| Backlight Factor | Budget Implementation | Premium Implementation | Clinical Impact | Cost Driver |
|---|---|---|---|---|
| Brightness Stability3 | Larger drift over time | More stable long-term behavior | Consistent appearance | LED binning + control loop |
| Thermal Management | Basic dissipation | Better thermal design/control | Predictable runtime performance | Mechanical/thermal engineering |
| Flicker Control | More flicker-prone dimming | Lower-flicker design | Comfort in long sessions | Driver sophistication |
| Color Temperature | Wider variation | Tighter control | More consistent color/white | Control + compensation |
| Uniformity Control | Limited compensation | Better uniformity management | Even illumination | Sensing/compensation design |
How to validate: request runtime stability checks (burn-in style), evaluate at different brightness levels, and test under realistic ambient temperature and duty cycles similar to your clinical workflow.
Why optical stacks matter under real clinical lighting
“AR/AG” on a datasheet can refer to very different optical stacks. The coating and surface stack influence glare, perceived sharpness, black levels, and readability under strong lighting.
AR/AG labels can hide large differences: optical stack design affects reflection control, contrast perception, and strong-light readability, which is critical in bright OR and procedure-room lighting.
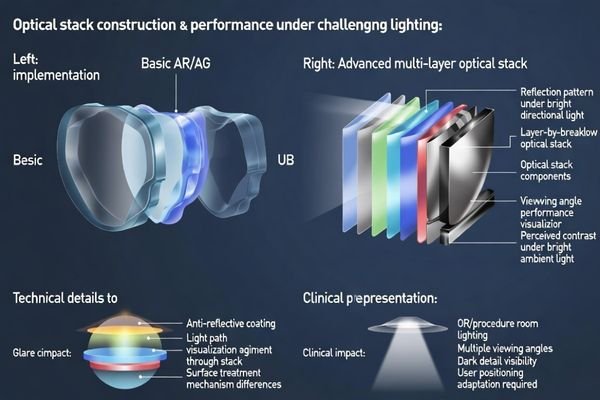
In real rooms, glare isn’t just annoyance—it can wash out dark details, reduce perceived contrast, and force staff to reposition screens. Higher-end optical stacks may add cost but help maintain readable images across viewing angles and lighting conditions.
Multi-Layer Coating Technologies and Performance
Premium multi-layer coatings4 typically require tighter process control and inspection, which increases cost but can reduce reflections more consistently across the panel. The practical benefit is easier readability at off-angles and under bright surgical lights.
Surface Treatment and Light Management
Surface treatments also balance clarity vs diffusion: too much diffusion can soften perceived sharpness, while too little can create mirror-like reflections. The “right” stack depends on the room lighting and the viewing behavior, so consistency and fit-to-use often matter more than a generic AR/AG label.
How to validate: test in representative lighting (bright angles, overhead lights), compare off-axis viewing, and use the same clinical content and typical viewing distance used in your environment.
Why disinfection durability changes total cost of ownership
Medical displays are cleaned frequently, often with aggressive disinfectants. Over time, coatings can haze, whiten, or become tacky if chemical resistance is weak—even if the monitor looked fine at delivery.
Price gaps often reflect front-surface durability: coating hardness and chemical resistance determine whether repeated disinfection causes haze, whitening, scratching, or long-term appearance change.
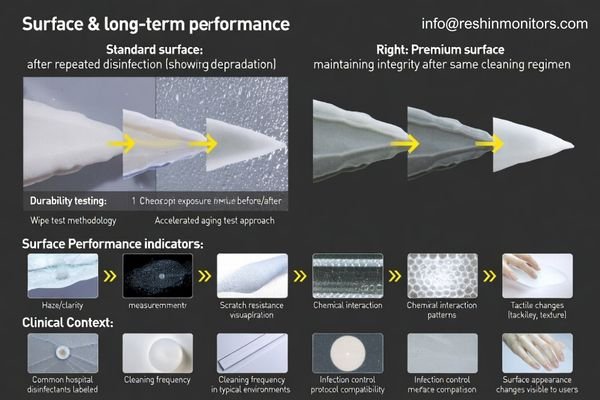
In day-to-day operations, durability is a workflow issue. If the surface degrades, staff may compensate by changing viewing angles, increasing brightness, or cleaning more aggressively—none of which is sustainable. Degradation also affects perceived professionalism and can create “sticky” cleaning experiences that slow turnovers. Because infection control protocols are non-negotiable, the display must tolerate the facility’s real disinfectants and wiping cadence, not an idealized lab condition.
Better surface stacks reduce the frequency of cosmetic failures that turn into service tickets and replacements. They also reduce variability across a fleet: when some units haze earlier than others, the facility ends up managing exceptions room by room. Over the lifecycle, chemical resistance is one of the clearest ways a lower upfront price can convert into higher replacement cost and more operational disruption, especially in high-cleaning environments like ORs and procedure suites.
How to validate: ask for disinfectant compatibility guidance5, request evidence of wipe-cycle testing (or equivalent durability validation), and confirm acceptable cleaning agents match your facility’s protocols.
Why integration tolerance separates “works” from “works everywhere”
Even with identical ports, monitors vary in how they handle long cables, splitters, switchers, converters, and recorders. Integration tolerance is one of the most common reasons “similar specs” behave differently on-site.
In complex installations, price differences often show up as better handshake tolerance, faster recovery from micro dropouts, and more stable behavior with long runs and multi-device switching chains.
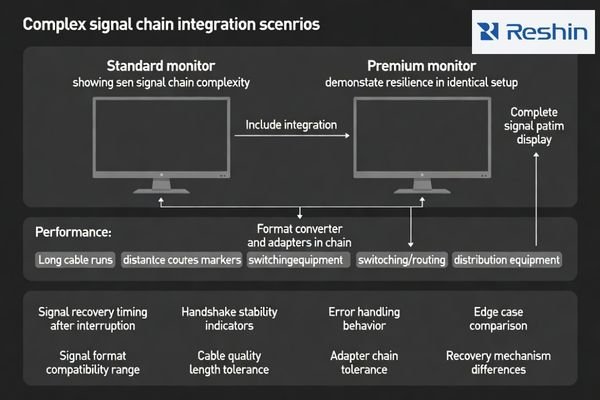
The monitor rarely sits in a simple point-to-point link. In real projects, signals pass through routing matrices, format converters, distribution amplifiers, and cables of varying lengths—often with multiple sources switching in and out throughout the day. Small tolerance margins become visible as intermittent re-sync events, brief black screens, or “only happens on this input” issues that are expensive to reproduce. A premium implementation often buys you margin: better error handling, steadier timing behavior, and less sensitivity to upstream quirks.
Integration tolerance6 also affects rollout speed. If a monitor is picky about certain converters or cable runs, the integrator must spend time tuning and documenting exceptions, which slows deployment and increases long-term service burden. In multi-site programs, those exceptions multiply fast. Paying for robustness can reduce the hidden labor cost of repeated site troubleshooting and make results more repeatable across rooms with slightly different infrastructure realities.
How to validate: build a representative “worst-case” chain (your cable lengths, your switchers, your converters), then test repeated switching, brief interruptions, and recovery behavior with measurable pass/fail criteria.
Why calibration and traceable QA change the real value
For diagnostic and regulated workflows, the ability to verify performance, document acceptance, and maintain traceable QA can be a major cost driver—especially when audits, governance, or accreditation require records.
For diagnostic use cases, price differences often reflect calibration workflows and traceable acceptance/QA records that help verify performance over time and reduce disputes during audits or compliance reviews.
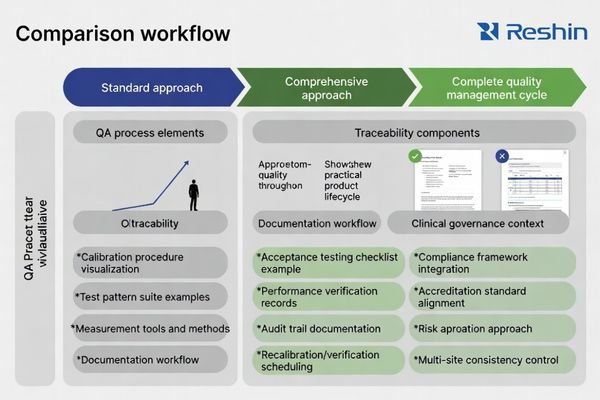
Traceability is an operational control tool, not just paperwork. Clear acceptance scripts, defined test conditions, and consistent documentation help teams align on “what good looks like” at delivery—and what must be re-checked later. Without that clarity, performance disputes become subjective (“looks fine to me”), and service teams lose time reconciling inconsistent settings or undocumented changes made during troubleshooting. A mature QA approach reduces ambiguity and makes lifecycle management more predictable.
The cost difference also reflects how easily QA can be executed in reality. If QA requires complex external tooling, custom procedures, or special know-how, the facility pays in ongoing labor and inconsistency. Better implementations support repeatable verification and reporting, which matters when multiple rooms must meet the same governance expectations over years. For facilities under accreditation or internal quality programs, traceable records reduce risk and make compliance discussions far simpler.
How to validate: request an acceptance checklist7, sample QA records, defined pass/fail criteria, and a recommended re-check schedule that matches your clinical governance requirements.
FAQ
Which factors explain price differences when specs look the same?
Long-term stability, screening consistency, integration tolerance, surface durability, and QA traceability usually explain more of the price than headline specs.
What should procurement compare first when quotes differ a lot?
Start with panel screening/consistency criteria, signal-chain validation scope, cleaning durability assumptions, and what acceptance/QA documentation is included.
Does “same ports” mean the same integration result?
No. Switching recovery, handshake tolerance, long-cable behavior, and micro-dropout resilience can differ widely even when the I/O list matches.
How can teams validate signal stability quickly before purchase?
Use your real chain: long-duration playback, repeated switching cycles, and the same matrices/converters/recorders planned for deployment.
Why do diagnostic (DICOM) monitors vary in price with similar resolution?
The gap is often in long-term grayscale stability, calibration workflows, and the ability to produce traceable QA records that support governance and audits.
What evidence should buyers request for acceptance and QA?
Ask for acceptance scripts, sample calibration/QA records, test conditions, and clear pass/fail criteria plus recommended re-check intervals.
Conclusion
Similar specs can hide major differences in stability, integration tolerance, durability, and QA traceability—all of which shape total cost of ownership in medical environments. A higher price can be justified when it reduces downtime risk, improves fleet consistency, and makes acceptance and long-term verification more predictable.
At Reshin, we focus on medical-grade display deployments where integration reality matters: stable signal behavior, repeatable appearance across rooms, disinfectant-resistant surfaces, and acceptance workflows that support long lifecycle operation. We help teams evaluate beyond the datasheet so the installed system stays reliable over time.
✉️ info@reshinmonitors.com
🌐 https://reshinmonitors.com/
-
Explore this link to understand how robust designs enhance stability and recovery in technology, crucial for efficient operations. ↩
-
Understanding these criteria helps ensure product quality and consistency, reducing future issues and costs. ↩
-
Understanding brightness stability can help you choose displays that maintain consistent performance over time. ↩
-
Explore how multi-layer coatings enhance display performance and readability, especially in challenging lighting conditions. ↩
-
Understanding disinfectant compatibility is crucial for maintaining display surfaces and ensuring they withstand cleaning protocols. ↩
-
Understanding integration tolerance is crucial for ensuring smooth deployment and minimizing long-term service issues in AV projects. ↩
-
An effective acceptance checklist is crucial for ensuring quality; explore resources to optimize your QA practices. ↩